

A reformed skeptic’s guide to embracing the snake
Look, I’ll be straight with you – I used to think Python was just another overhyped programming language. Another tool in an already crowded toolbox. Then I actually tried it for real analysis work, and… well, here we are. Me, writing an entire article about why Python might just be the best thing that’s happened to data analysis since spreadsheets (controversial take, I know).
What Makes Python the Best Programming Language for Data Analysis?
Here’s the thing about Python that nobody tells you upfront: it’s sneaky good. While other languages are busy showing off their complexity, Python just… works. It’s like that reliable friend who shows up with pizza when you’re having a crisis – unassuming but exactly what you need.
The syntax doesn’t hate you. Unlike some languages I could mention (cough looking at you, Java cough), Python reads almost like English. When I first started, I was genuinely shocked that I could understand what my own code was doing six months later. Revolutionary concept, right?
It scales with your ambition. Started with simple data cleaning? Great. Want to build machine learning models? Python’s got you. Need to scrape APIs and automate your entire workflow? Still Python. It’s like having a Swiss Army knife that keeps revealing new tools just when you need them.
Why Python Dominates Data Science Languages and Tools
Let’s talk numbers for a second (because we’re analysts, after all). Python consistently ranks as one of the most used programming languages for data science, and there’s a reason for that beyond just hype.
The ecosystem is absurdly rich. When I say Python has libraries for everything, I mean everything. Pandas for data manipulation (yes, named after “panel data” – not the cute animals, though the confusion is understandable). NumPy for numerical computing. Matplotlib and Seaborn for visualization. Scikit-learn for machine learning. The list goes on, and frankly, it’s a bit overwhelming in the best possible way.
Community support that actually helps. Ever tried searching for solutions in other programming communities? It’s like asking for directions in a foreign country where everyone speaks in riddles. Python’s community? They actually want to help you succeed. Stack Overflow threads that make sense. Documentation that doesn’t assume you have a PhD in computer science. It’s refreshing.
Best Programming Language for Data Analysis and Visualization?
I’ve tried R (respect to the statisticians), dabbled with Julia (impressive, but still niche), and even tortured myself with Excel’s “advanced” features. But for the complete package – analysis, visualization, and everything in between – Python keeps winning.
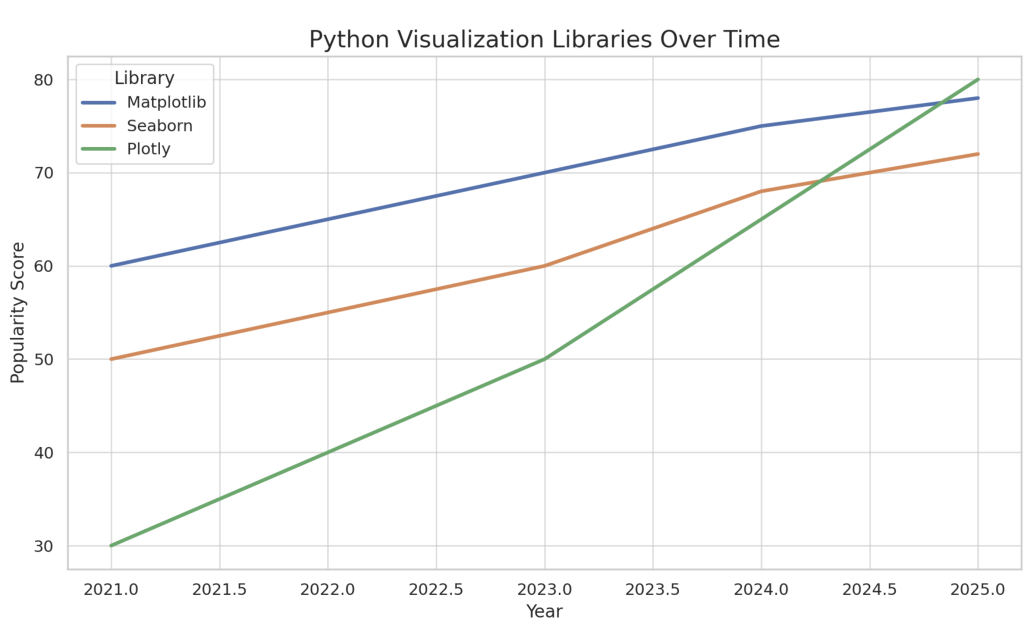
Visualization that doesn’t make you cry. Remember the dark days of trying to make Excel charts that didn’t look like they were designed in 1995? Python’s visualization libraries actually produce graphics you’d be proud to show in a boardroom. Matplotlib gives you control, Seaborn makes things beautiful by default, and Plotly brings interactivity that’ll make your stakeholders think you’re some kind of data wizard.
Integration with everything. APIs? Check. Databases? Obviously. Cloud platforms? Of course. That random CSV file someone emailed you? Python handles it without complaining. It’s like having a universal translator for data sources.
Programming Language for Analysts: Why Free Matters
Here’s my favorite part about Python – it costs exactly zero dollars. While other enterprise solutions are busy emptying your budget, Python just sits there, being excellent and free. No licensing headaches, no “per-seat” charges that make your finance team twitchy.
Open source doesn’t mean lower quality. If anything, Python’s open-source nature means it evolves faster than proprietary alternatives. When the community finds a better way to do something, everyone benefits immediately. It’s capitalism’s better-looking cousin.
Best Programming Language for Analysts: The Real-World Test
Let me get practical for a moment. As a business analyst, I deal with messy data, unrealistic deadlines, and stakeholders who change their minds faster than I change my coffee filters. Python handles all of this with surprising grace.
Data cleaning that doesn’t destroy your soul. Pandas makes data manipulation feel almost therapeutic. Missing values? Handled. Inconsistent formatting? Fixed. Data types that make no sense? Corrected. It’s like having a really good assistant who anticipates your needs.
Automation that actually works. I’ve automated everything from report generation to API monitoring with Python. The best part? When something breaks (and it will), the error messages actually help you figure out what went wrong. Novel concept.
Getting Started: Your Roadmap to Python Mastery
Alright, enough philosophy. Here’s how you actually become dangerous with Python:
Start with the basics, but don’t get stuck there. If you’re completely new to Python, I’d recommend checking out our beginner’s guide to Python programming – it covers the fundamentals without making you feel like you need a computer science degree. Once you’ve got the syntax down, immediately start working on real problems. Tutorials are great, but nothing beats the panic-induced learning that comes from having actual deadlines.
Embrace the ecosystem gradually. Don’t try to learn every library at once – that way lies madness. Start with Pandas for data manipulation, add Matplotlib for basic visualizations, then expand as needed. The official Python documentation is surprisingly readable (I know, shocking for technical docs), and Real Python offers tutorials that won’t put you to sleep.
Join the community, but curate your sources. Reddit’s r/learnpython is gold for beginners. Stack Overflow for when you’re truly stuck. The Python Package Index (PyPI) is where you’ll find all those magical libraries I keep mentioning. But be selective – not every Python influencer needs your attention.
The Honest Truth About Python for Data Analysis
Is Python perfect? Absolutely not. It can be slower than compiled languages for certain tasks. The package management can occasionally drive you to drink. And don’t get me started on Python 2 vs. 3 (though thankfully, that war is mostly over).
But here’s what Python gets right: it removes barriers instead of creating them. It lets you focus on the analysis instead of wrestling with the tools. And in a world where data is everything, that matters more than theoretical performance benchmarks.
Why Python Remains the Top Choice
After years of analysis work, switching between different tools and languages, I keep coming back to Python. Not because it’s trendy (though it is), not because everyone else uses it (though they do), but because it consistently gets out of my way and lets me do my job.
That’s the real test of any analyst tool – does it help you find insights, or does it become another obstacle? Python passes that test, repeatedly and reliably.
So if you’re on the fence about learning Python, stop overthinking it. Download it, install Jupyter Notebook, and start playing with some data. You might surprise yourself with how quickly you go from curious to capable.
Now if you’ll excuse me, I have some APIs to wrangle and some data to analyze. The snake and I have work to do.
